A fun model to explain the surging popularity of Mendelian randomization
I was preparing for my talk in EPFL’s statistics seminar today and discovered an interesting model. As many people know, the popularity of Mendelian randomization (MR) has been fast growing in the last few years. In fact, Google Scholar is now giving me one or several recommended articles on MR almost every day.
In the past, I have attributed this to the increasing availability of genome-wide association studies (GWAS). Today I find some quantitative evidence for this. The next figures show the number of publications on MR versus the number of publications on GWAS from 2007 to 2020 and demonstrates a good quadratic trend.
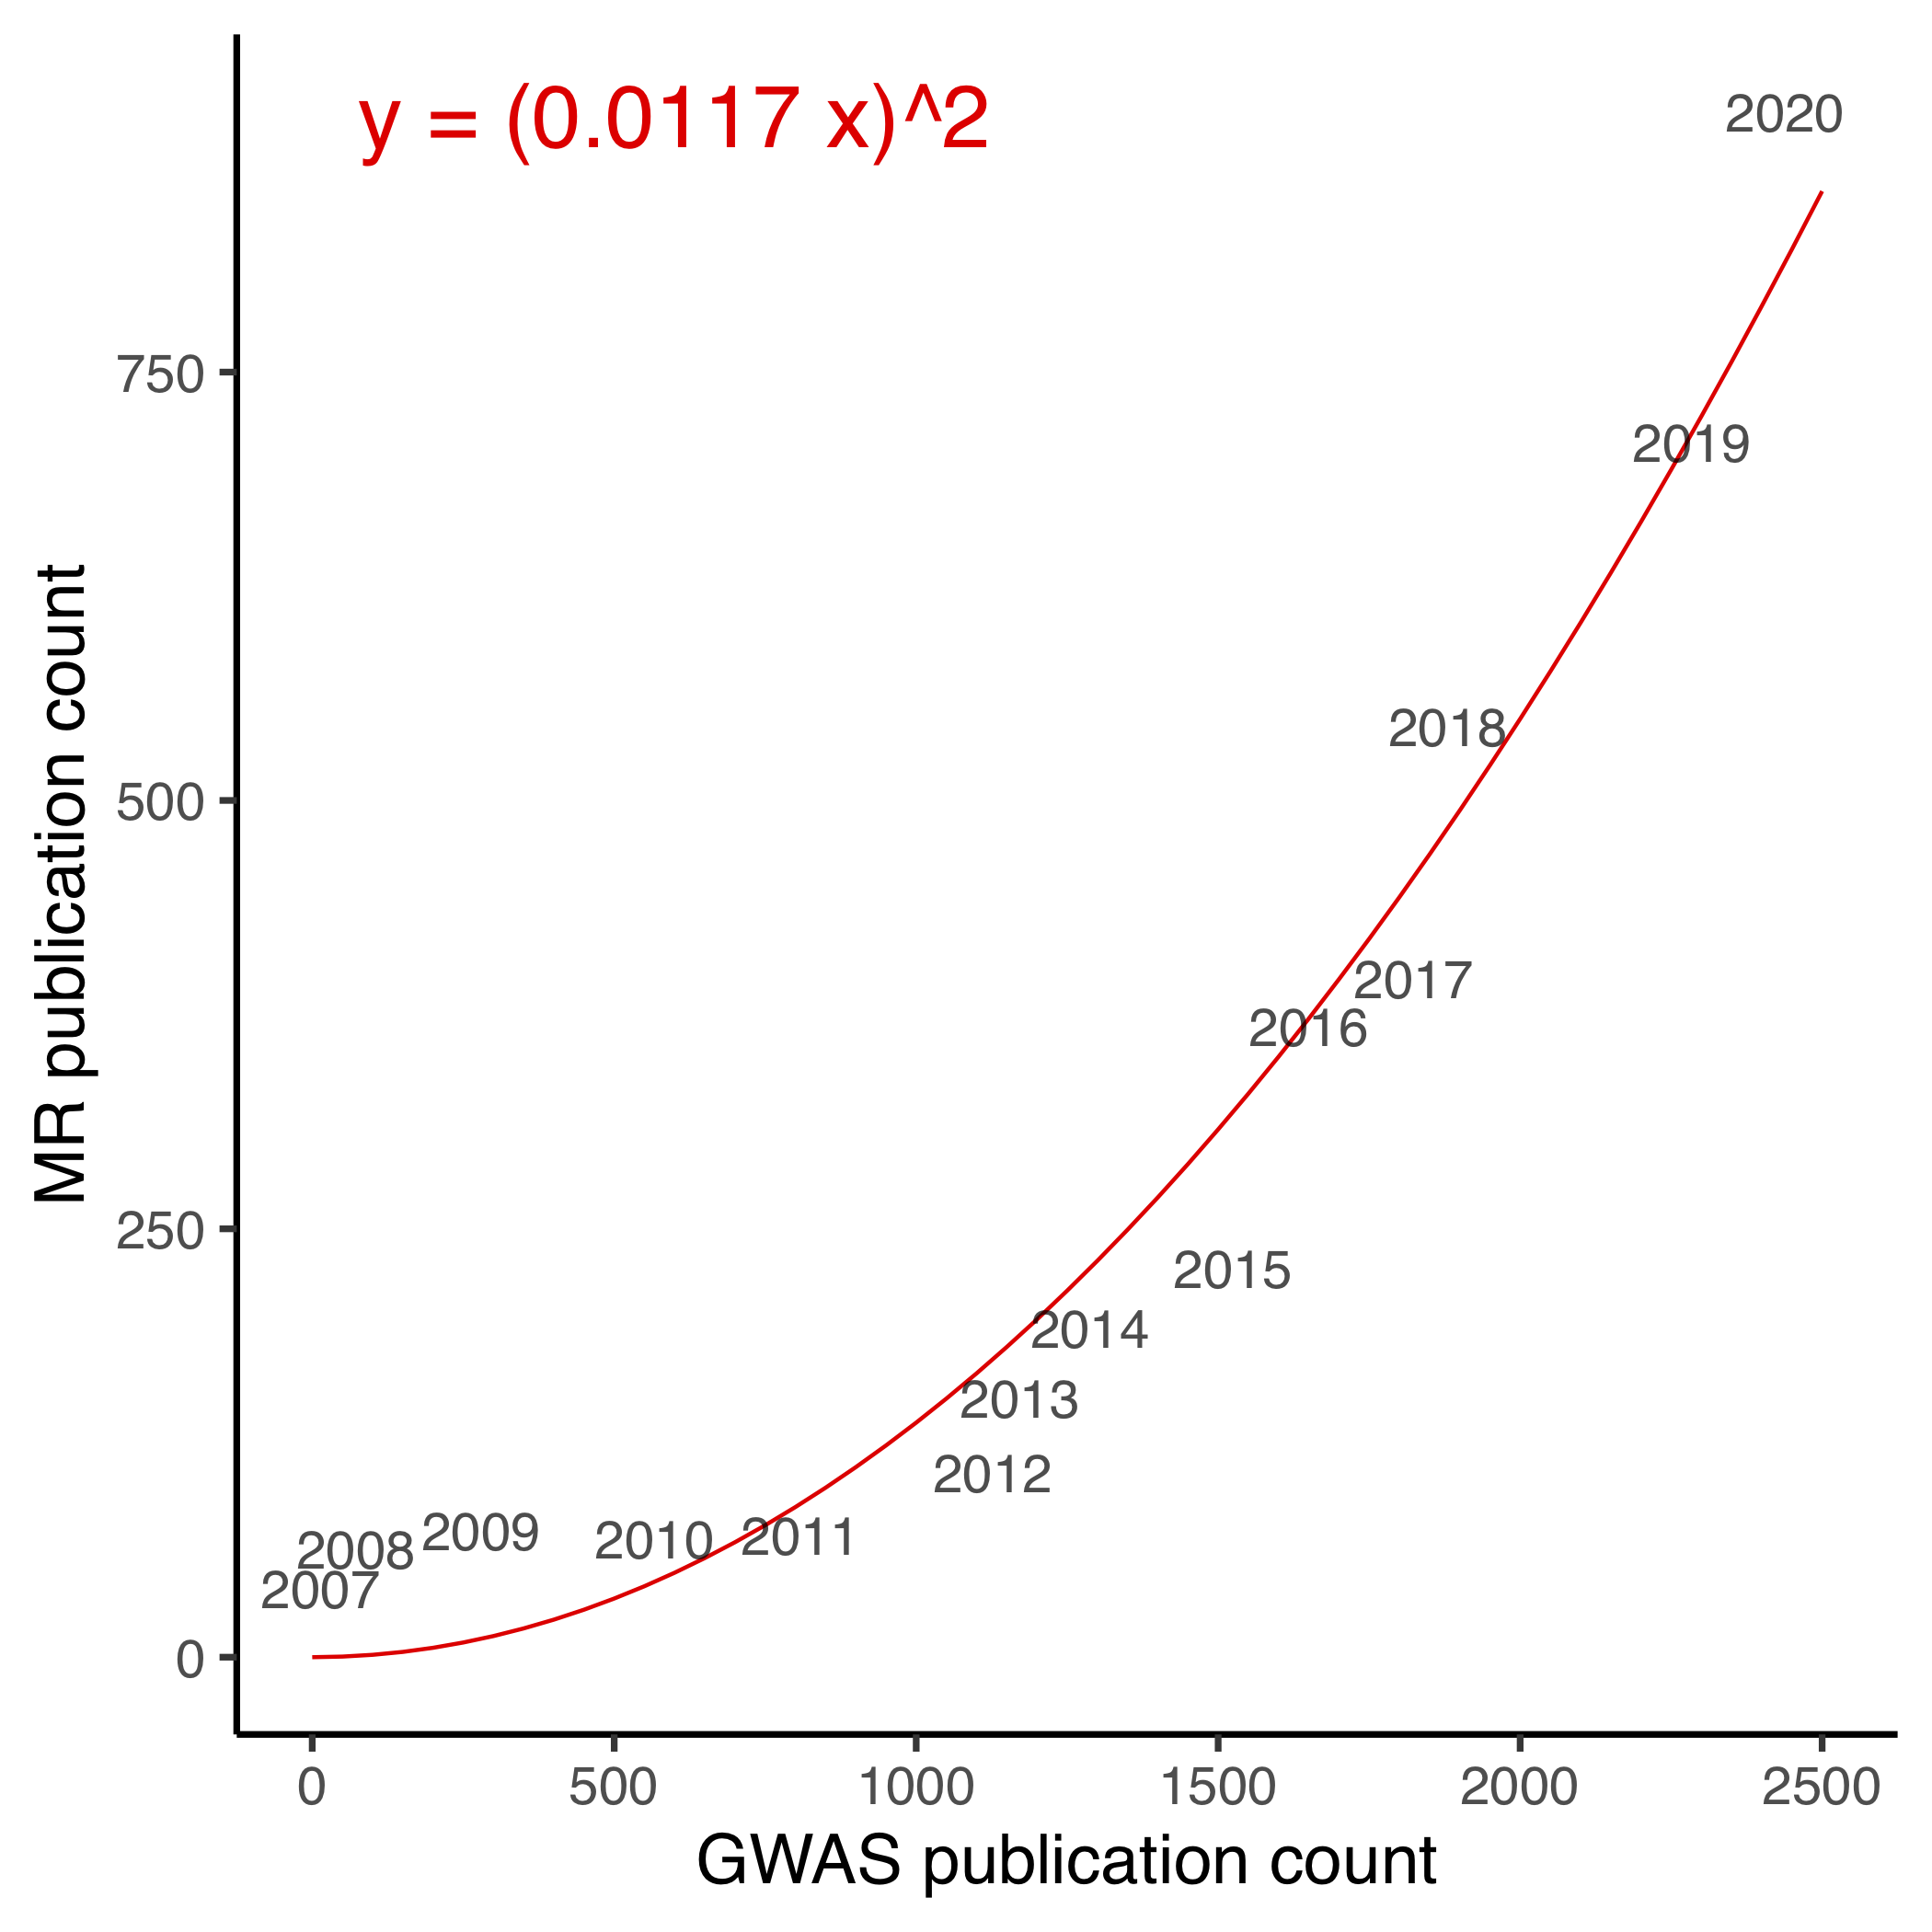
Why should the curve be quadratic? I think this is simply because most MR studies are using the two-sample design, where one GWAS is used to estimate gene-exposure associations and the other gene-outcome. This process has been made extremely streamlined and easy by the TwoSampleMR package. Theoretically speaking, you can pick any two GWAS and public an MR paper.
In other words, a theoretical upper bound for the number of MR publication is \(y \leq {x \choose 2} \approx n^2/2\). This is obviously a pretty bad idea, partly because not all exposure-outcome pairs make sense/are interesting, partly because you would suffer from substantial winner’s curse bias (we have proposed to solve this by the three-sample design).
Let’s see how well this model stands the test of time.