Statistics IB
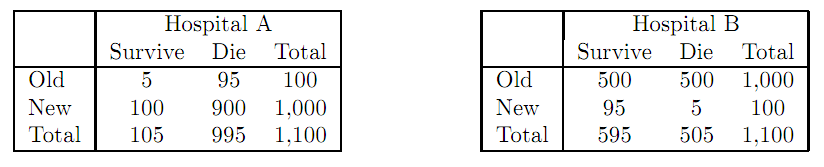
An example of Simpson's paradox:
This is a home page for a course
of
16 lectures to second year Cambridge mathematics students
over 8 weeks.
Current students please note that the course schedule has changed since these notes were written in 2007. What is here is still relevant, but the new schedule covers the general linear model, and Gauss-Markov theorem, which is not covered in these notes.
Each lecture is relatively self-contained and has course notes of four A4 pages. Here are the schedules.
There are three examples sheets. Students should receive three supervisions on the examples sheet. There are recommended books. If you enjoy this course then you should consider related courses in Part II and other items of interest.
This material is provided for students, supervisors (and others) to freely use in connection with this course. Copyright remains with the author.
Course notes
A4 size (1 page per sheet) A5 size (2 pages per sheet)Examples sheet
There are three examples sheets; each is a pdf file of 2 pages. The questions appear in the same order as topics are covered in lectures and you will find a recommendation on the sheet concerning the work you should do for your supervisions. Viewing and printing is identical as for the notes above.sheet 1 (lectures 1-5), sheet 2 (lectures 6-10), sheet 3 (lectures 11-16). sheet 4 (supplementary questions).
You may like to look at comments which a supervisor wrote about the attempts that his students made on the examples sheets. He notes things that they did wrong and where they had difficultiess. You could usefully use these comments as hints and try to do better than these students.
Hints for sheet 1, hints for sheet 2, hints for sheet 3
Overhead Slides and Digressions
I include a small (non-examinable) digression half way through each lecture.- Anchoring and bias. (lecture 1)
- A method of conducting a questionaire about a sensitive topic. (lecture 2)
- How many words did Shakespeare know? (lecture 3)
- A confidence interval for the remaining life of the human race. (lecture 4)
- Utility and lotteries. (lecture 5)
- The Alias paradox. (lecture 6)
- The Ellsberg paradox. (lecture 7)
- An estimation game. (lecture 8)
- A statistical love story. (lecture 9)
- Benford's distribution for the leading digit. (lecture 10)
- An analysis of Jane Austin's style. (lecture 11)
- Latin squares and experimental design. (lecture 12)
- The Stein estimator. (lecture 13)
- Factor analysis and the Myers-Briggs test. (Lecture 14)
- Discriminant analysis, principal components, bootstrap. (Lecture 15)
Here is a nice diagram showing relationships between distributions.
Exam questions
Here is single fille of all Tripos questions on Statistics for the years 2004-presentThis file has exam questions from 1988-1999. Questions since 2001 can be found here.
Recommended Books
- D. A. Berry and B. W. Lindgren, Statistics, Theory and Methods, Duxbury Press, 1995, ISBN 0-534-50479-5.
- G. Casella and J. O. Berger, Statistical Inference, 2nd Edition, Brooks Cole, 2001, ISBN 0-534-24312-6.
- M. H. De Groot, Probability and Statistics, 3rd edition, Addison-Wesley, 2001, ISBN 0-201-52488-0.
- W. Mendenhall, R. L. Scheaffer and D. D. Wackerly, Mathematical Statistics with Applications, Duxbury Press, 6th Edition, 2002, ISBN 0-534-37741-6.
- J. A. Rice, Mathematical Statistics and Data Analysis, 2nd edition, Duxbury Press, 1994, ISBN 0-534-20934-3.
- G. W. Snedecor, W. G. Cochran,
Statistical Methods,
Iowa State University Press, 8th Edition, 1989, ISBN 0-813-81561-4.
Related Courses
There are courses in Part II that build on what students learn in this course.In Part IIA there is Computational Statistics and Statistical Modelling.
In Part IIB there is Statistical Inference.
Other items of interest
Chance News reviews current issues in the news that use probability or statistical concepts.Rate Your Risk Quiz. E.g. What is the risk of your being wiped out (with nearly everybody else) next year by a catastrophic comet, meteor, or asteroid impact? One in 750,000? One in 20,000? One in 15,000,000?
Wikipedai entriies of some famous statisticians: Bayes (Bayesian inference), Gosset (Student's t-distribution), Neyman (Neyman-Pearson test), Pearson (Neyman-Pearson test).
An interesting item about speed cameras and whether or not they actually reduce the rate of accidents.
Last modified: 17 January 2007