Lecture 4: Graphs and Path Analysis

Causal Inference and Statistical Designs · Michaelmas 2026 · Qingyuan Zhao

4. Enrichment designs: FOURIER trial

Evolocumab (PCSK9 inhibitor) versus placebo; overall primary-endpoint hazard ratio 0.85.
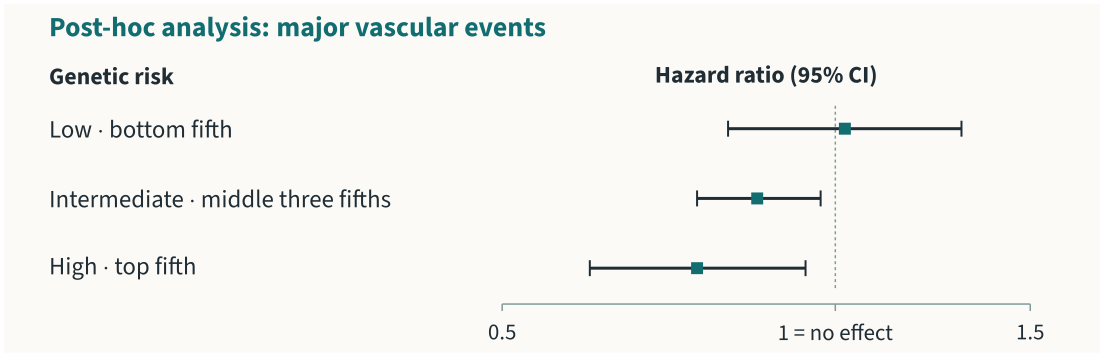
Post-hoc genetic analysis of FOURIER, with the endpoint major vascular events. Corrected hazard ratios for low, intermediate and high genetic risk are 1.02 (0.80–1.30), 0.85 (0.75–0.97) and 0.75 (0.60–0.94). One enlarged forest plot shows all three confidence intervals on a log-ratio axis, with a no-effect line at one.

Possible enrichment: recruit broadly → select subgroup → concentrate recruitment.

Results redrawn: Sabatine et al. (2017), Evolocumab and Clinical Outcomes…; Marston et al. (2020), Predicting Benefit From Evolocumab Therapy…, Fig. 2, corrected 2024.

4. Enrichment designs: Selecting a subgroup

  • One treatment; five prespecified subgroups, with treatment effects \(\beta_j\).
  • Independent normal outcomes, variance 1; larger is better. Test \(H_S:\beta_S\le0\).
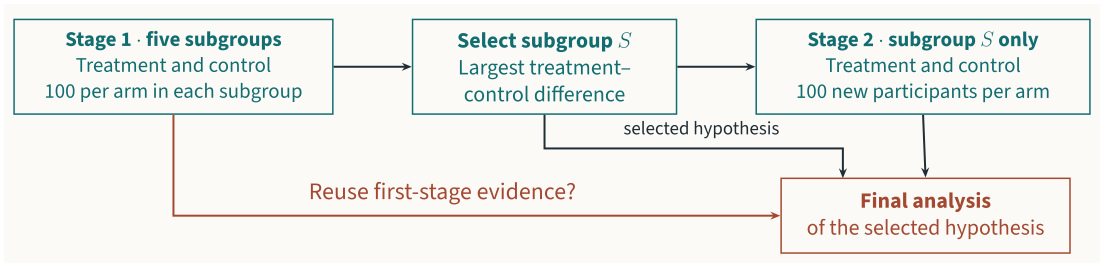
Stage 1 randomizes 100 to treatment and 100 to control within each of five disjoint subgroups. Select subgroup S with the largest first-stage treatment-control difference. Stage 2 recruits only subgroup S and randomizes 100 new participants per arm. Arrows show how selection and first-stage evidence can enter the final analysis.

4. Enrichment designs: Simulation results.

Nominal one-sided level: 5% · Probabilities calculated by numerical integration.

Rejection probability (%) Pooled \(z\) Bonferroni–
Bonferroni
Stage 2 \(z\) only Selective \(z\)
Effects \((0,0,0,0,0)\)
Marginal false rejection 16.6 4.9 5.0 5.0
Effects \((0.3,0,0,0,0)\)
Marginal false rejection 5.2 2.0 0.9 0.9
False rejection given \(S\in\{2,3,4,5\}\) 28.2 10.6 5.0 5.0
Power given \(S=1\) 95.3 73.7 68.3 69.7
Effects \((0.3,-0.3,-0.3,-0.3,-0.3)\)
Power given \(S=1\) 91.5 70.6 68.3 88.5

Adaptive experiments

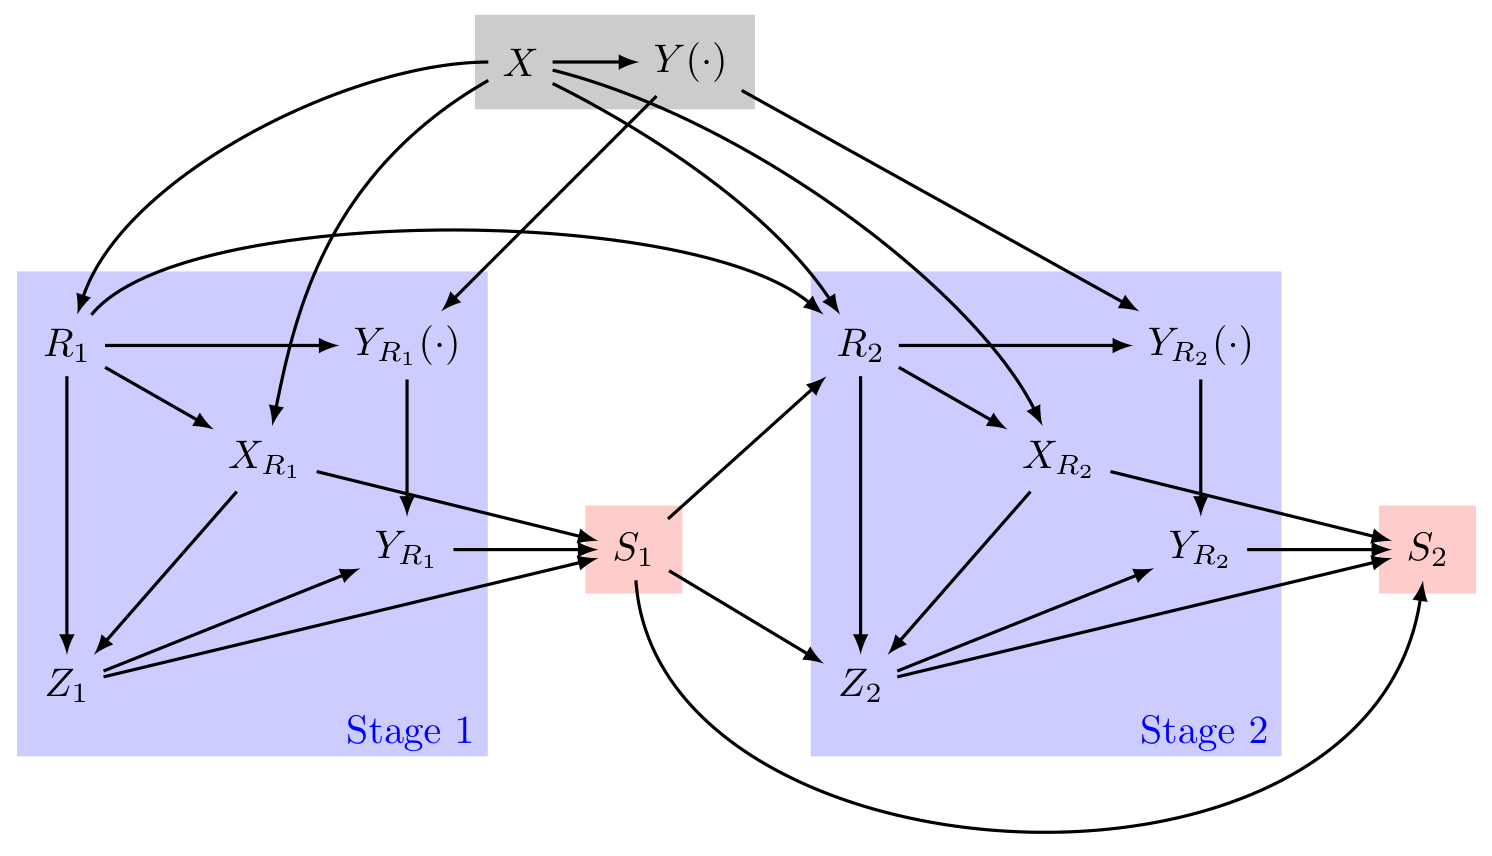
Freidling, Zhao and Gao’s original Figure 3: a directed acyclic graph of a two-stage adaptive trial. First-stage data determine selection S1, which affects second-stage recruitment R2 and treatment assignment Z2. Each stage shows recruitment, covariates, potential outcomes, treatment assignment and observed outcomes; S2 denotes the final selection.

Freidling, Zhao and Gao (2026), Selective Randomization Inference for Adaptive Experiments, Fig. 3, p. 9. CC BY 4.0; cropped from the original.

Sequential, multiple assignment, randomized trial (SMART) design

Families in 108 schools.
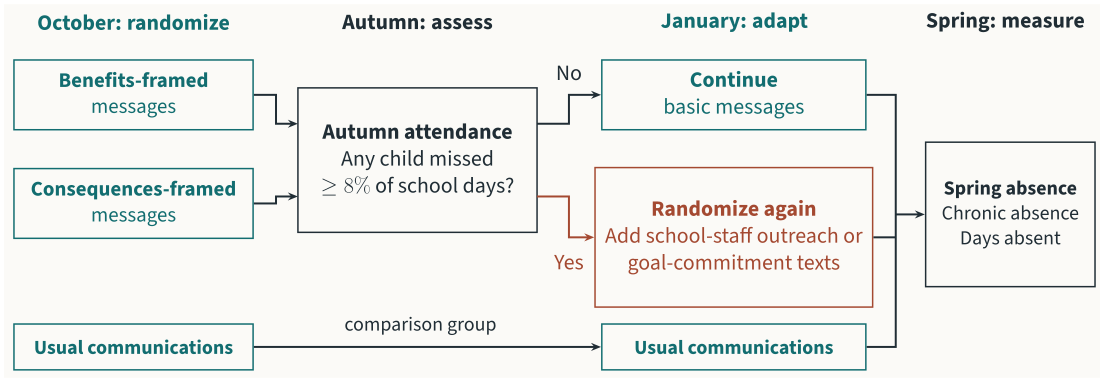
Families are randomized to benefits-framed messages, consequences-framed messages or usual communications. If any child missed at least 8% of autumn school days, a messaging family is rerandomized in January to added school-staff outreach or goal-commitment texts. Otherwise basic messages continue. All pathways lead to measured spring absence from 2 January to the end of term, including chronic absence and days absent.

Heppen, Kurki and Brown (2020), Can Texting Parents Improve Attendance in Elementary School?, pp. 3–4, Exhibit 5. Design redrawn.

SMART design: Treatment–confounder feedback

The same family receives successive interventions. A possible causal structure:
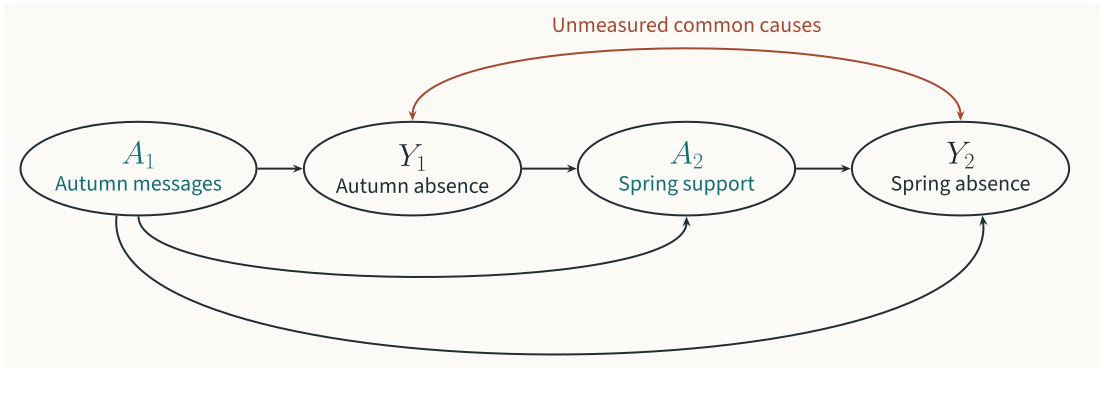
Possible causal structure with elliptical nodes and neutral directed edges. Autumn messages A1 may affect autumn absence Y1, spring support A2 and spring absence Y2. Y1 determines support eligibility; A2 may affect Y2. A rust bidirected edge between Y1 and Y2 represents unmeasured common causes of autumn and spring absence.

\(Y_1\) is post-treatment for \(A_1\), but pre-treatment for \(A_2\).

Design: Heppen, Kurki and Brown (2020), report. Causal diagram: teaching schematic. Further reading: Hernán and Robins, Causal Inference: What If, chs. 19–21.

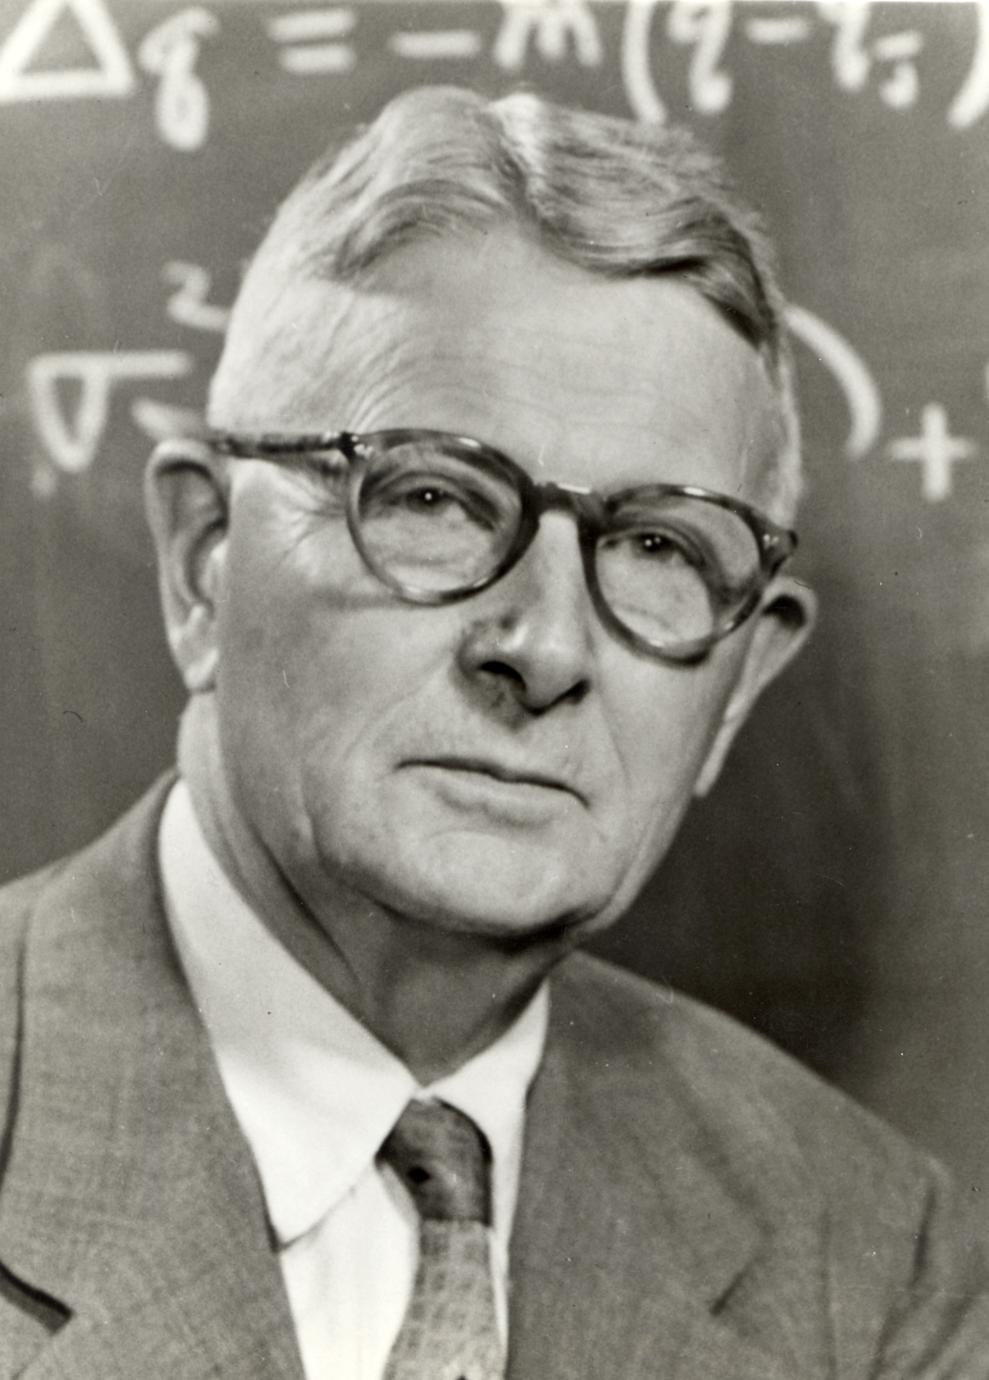
Sewall Wright (1889–1988)

Sewall Wright in 1965, from the University of Wisconsin–Madison Archives.

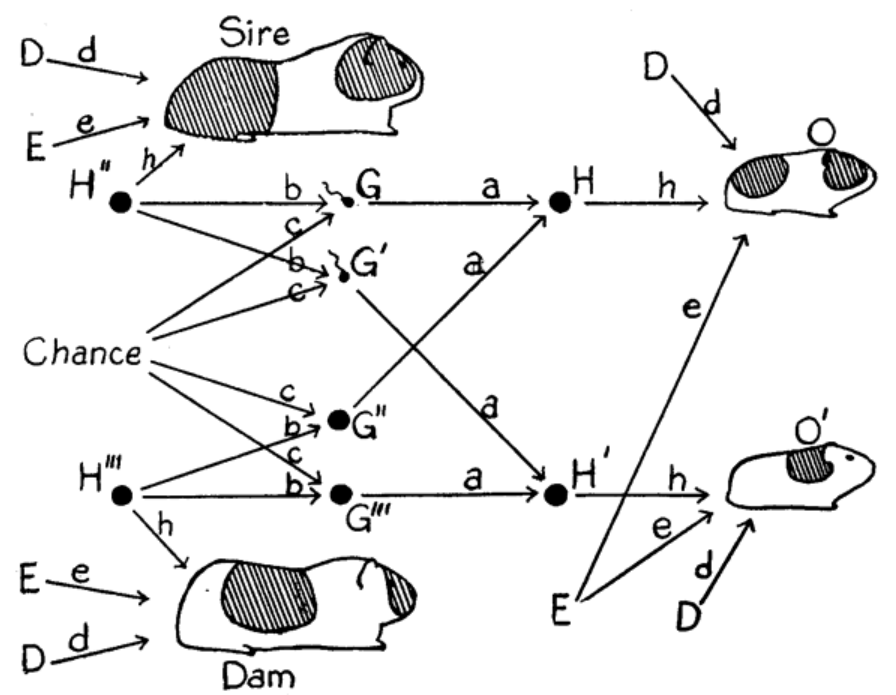
Heredity and environment (1920)

Wright’s original guinea-pig diagram: heredity, shared environment and developmental variation contribute to the patterns of litter mates.

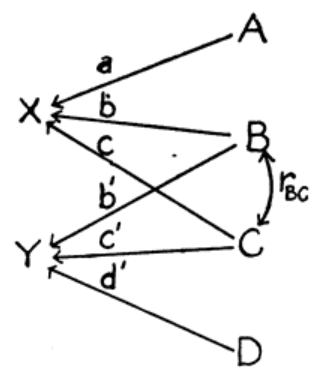
Wright’s original mixed graph: B and C both cause X and Y; a double-headed curved edge connects B and C.

Wright (1920), The Relative Importance of Heredity and Environment in Determining the Piebald Pattern of Guinea-Pigs, Figs. 5–6, pp. 328–329; public domain. Portrait (1965): UW–Madison Archives, © UW System Board of Regents; educational use permitted.